Note
Click here to download the full example code
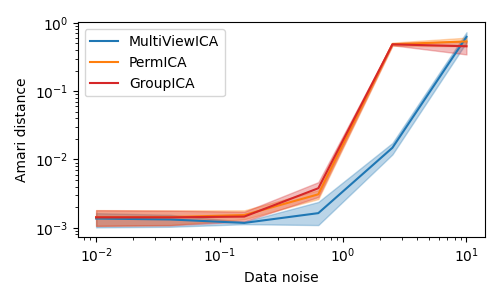
Experiments on synthetic data
Out:
/home/circleci/miniconda3/envs/testenv/lib/python3.10/site-packages/sklearn/utils/extmath.py:368: FutureWarning: If 'random_state' is not supplied, the current default is to use 0 as a fixed seed. This will change to  None in version 1.2 leading to non-deterministic results that better reflect nature of the randomized_svd solver. If you want to silence this warning, set 'random_state' to an integer seed or to None explicitly depending if you want your code to be deterministic or not.
  warnings.warn(
# Authors: Hugo Richard, Pierre Ablin
# License: BSD 3 clause

import numpy as np
import matplotlib.pyplot as plt

from multiviewica import permica, groupica, multiviewica

# sigmas: data noise
# m: number of subjects
# k: number of components
# n: number of samples
sigmas = np.logspace(-2, 1, 6)
n_seeds = 3
m, k, n = 5, 3, 1000

cm = plt.cm.tab20
algos = [
    ("MultiViewICA", cm(0), multiviewica),
    ("PermICA", cm(2), permica),
    ("GroupICA", cm(6), groupica),
]


def amari_d(W, A):
    P = np.dot(W, A)

    def s(r):
        return np.sum(np.sum(r ** 2, axis=1) / np.max(r ** 2, axis=1) - 1)

    return (s(np.abs(P)) + s(np.abs(P.T))) / (2 * P.shape[0])


plots = []
for name, color, algo in algos:
    means = []
    lows = []
    highs = []
    for sigma in sigmas:
        dists = []
        for seed in range(n_seeds):
            rng = np.random.RandomState(seed)
            S_true = rng.laplace(size=(k, n))
            A_list = rng.randn(m, k, k)
            noises = rng.randn(m, k, n)
            X = np.array([A.dot(S_true) for A in A_list])
            X += [sigma * A.dot(N) for A, N in zip(A_list, noises)]
            _, W, S = algo(X, tol=1e-4, max_iter=10000)
            dist = np.mean([amari_d(W[i], A_list[i]) for i in range(m)])
            dists.append(dist)
        dists = np.array(dists)
        mean = np.mean(dists)
        low = np.quantile(dists, 0.1)
        high = np.quantile(dists, 0.9)
        means.append(mean)
        lows.append(low)
        highs.append(high)
    lows = np.array(lows)
    highs = np.array(highs)
    means = np.array(means)
    plots.append((highs, lows, means))

fig = plt.figure(figsize=(5, 3))
for i, (name, color, algo) in enumerate(algos):
    highs, lows, means = plots[i]
    plt.fill_between(
        sigmas, lows, highs, color=color, alpha=0.3,
    )
    plt.loglog(
        sigmas, means, label=name, color=color,
    )
plt.legend()
x_ = plt.xlabel(r"Data noise")
y_ = plt.ylabel(r"Amari distance")
fig.tight_layout()
plt.savefig(
    "../figures/synthetic_experiment.png",
    bbox_extra_artists=[x_, y_],
    bbox_inches="tight",
)
plt.show()
Total running time of the script: ( 0 minutes 15.249 seconds)